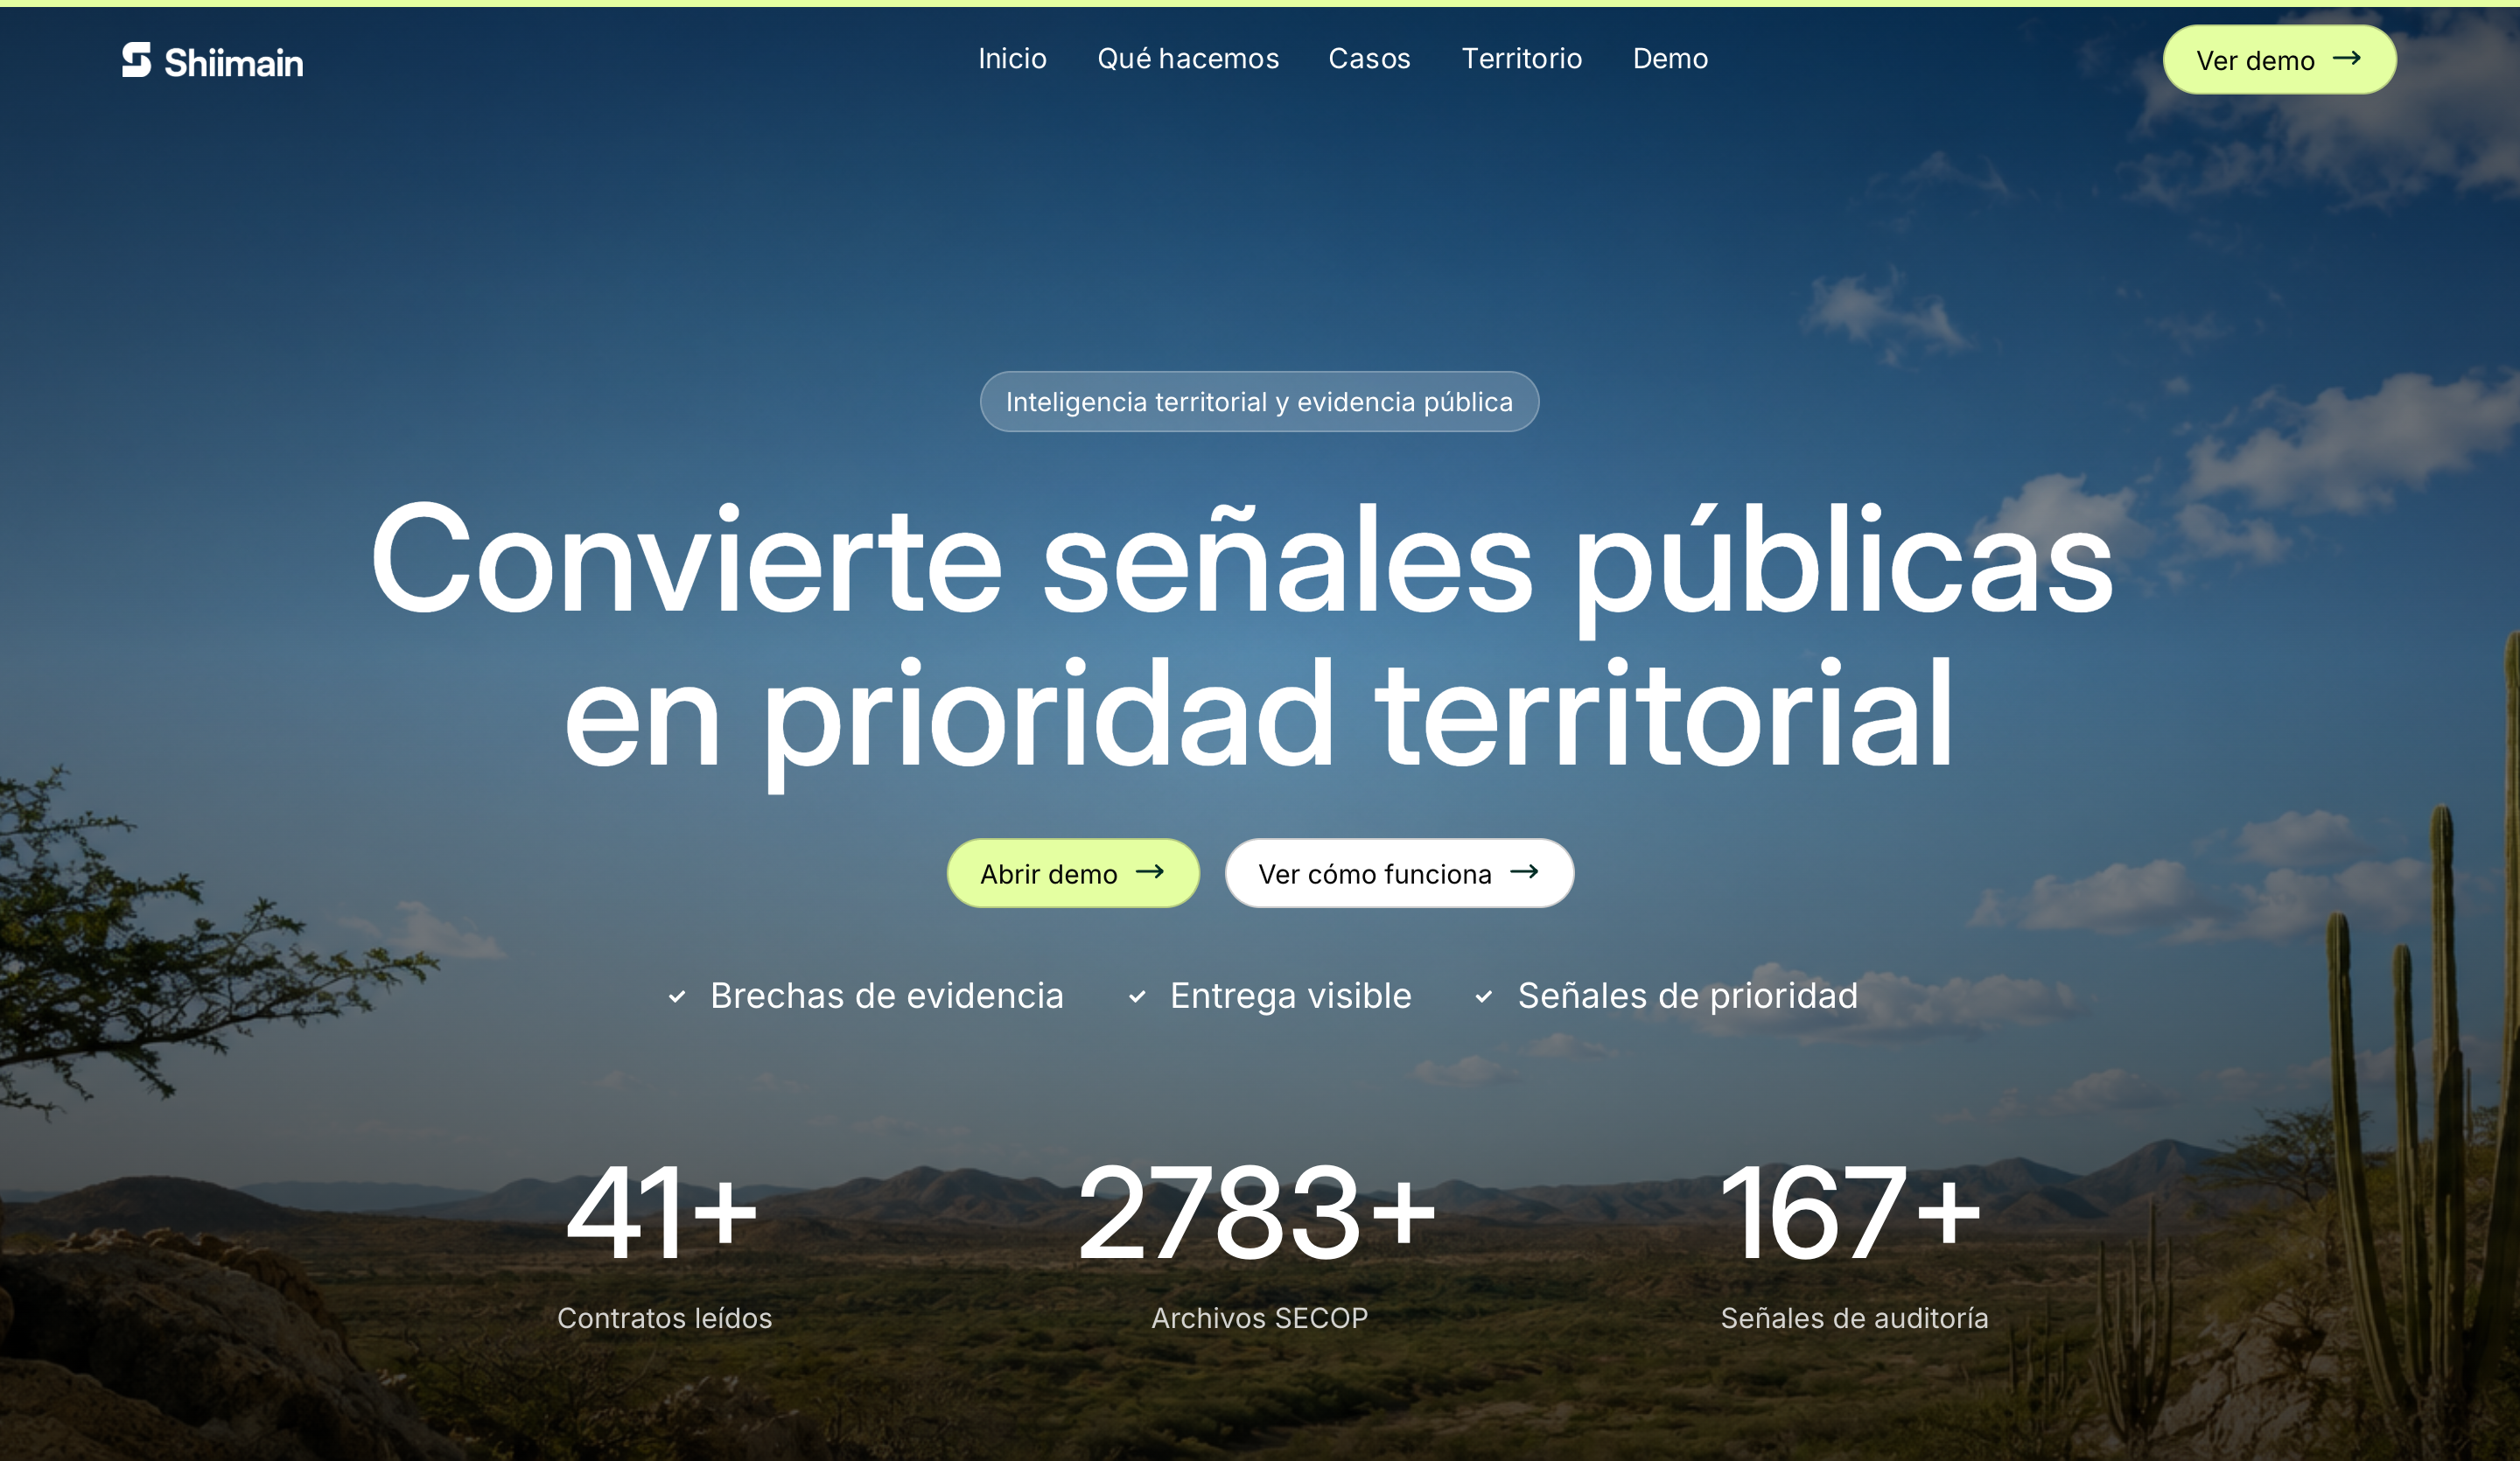
What our data visualization service includes
Every project starts from the question a view has to answer and the data you actually have. Depending on the brief, the scope includes:
- Question and dataset mapping: who needs to decide what, and which fields, units and dates support it
- Chart, table, map and filter design, chosen for comprehension rather than novelty
- Responsive exploration flows that keep their meaning on a phone
- Source, date and freshness shown in the interface, next to the numbers
- Designed states for empty, missing, incomplete and error data
- Accessible alternatives such as data tables and text summaries
- Front-end implementation as a web interface, a dashboard built in Power BI or Tableau, or a documented design handoff
Custom data visualization or a BI tool like Power BI or Tableau?
Dardo does both: we design and build custom web dashboards and visualizations, and we build dashboards in Power BI or Tableau. For internal reporting with standard charts, a team already licensed for Power BI or Tableau is usually better served by a dashboard built there: it's quick to set up and people already know the tool. A custom web interface earns its cost when the audience is public or external, when the visualization lives inside a website or product, when it has to carry your brand, when the story needs a guided sequence, or when maps, interaction, layout, accessibility and performance have to be controlled closely.
Many projects combine both: your team works in a Power BI or Tableau dashboard, and a custom web interface presents a curated, explained view to people who will never open one. If you're unsure which fits, the proposal recommends one based on who will use it, your data and the licenses you already have. If the whole product needs UX work beyond its data views, product design is the better starting point; if the goal is an immersive 3D experience, see interactive 3D websites.
Start with the question, then the data
A useful visualization begins with the decision a person needs to make. We document source, date, units, geography, transformations and missing values, and we separate supplied facts from calculated values and interface labels, so a future data update can't silently change what a chart means.
Sketches then compare chart, map, table and narrative options against realistic data, including extremes and gaps. Sometimes a sortable table answers the question better than any graphic, and we'll say so.
Designing dashboards, maps and data stories people can read
A dashboard needs hierarchy: a few measures with context, sensible comparisons and filters whose state is always visible. A map should establish the place before asking for analysis and keep period and source in view as people zoom and filter. A data story guides the reader through a sequence, then opens up exploration.
On small screens we decide which labels, controls and comparisons survive instead of shrinking everything. Color is never the only carrier of meaning, keyboard focus follows a useful order, motion respects reduced-motion settings, and a table or text alternative keeps the information available when a chart can't be operated.
Proof: Shiimain and Janus Observatory
Shiimain is a territorial-intelligence interface that starts with place, including a map view of La Guajira, then opens the evidence behind it in an exploratory dashboard. It's a public Vite and React prototype that presents public-source evidence and makes missing evidence visible. It is an archived learning project without a production backend, authentication or write operations, and it doesn't certify the underlying datasets.
Janus Observatory turns a speculative research structure into a 3D browser journey with an atlas of ten possible futures and an observatory for comparing them. Behind it sit a Python data pipeline, source-manifest checks and citation and link validation. Its scenarios are exploratory rather than forecasts, and neither project claims measured engagement, learning or adoption.
Data accuracy, ownership and upkeep
Before launch we agree the data owner, refresh method, validation checks, empty and error states, citation format and what happens to old data. Acceptance uses known test records and compares displayed values with source totals, so a polished interface can't hide a broken transformation. We validate our transformations and the values on screen; the accuracy of the source data and the right to publish it stay with its owner unless a separate research scope is agreed.
What affects the cost of a data visualization project?
Cost depends mostly on the data: the number and condition of sources, how much cleaning and normalization is needed, the number of views and interactions, static versus refreshed data, maps or 3D, user roles and authentication for a production tool, accessibility alternatives and languages. The inquiry form's budget bands run from under USD 5,000 to above 60,000. A representative data sample is the fastest route to a reliable estimate.
Dardo designs data interfaces for US and Latin American teams. We are a three-person, founder-led studio based in Bogotá, working in English and Spanish, with meeting overlap and review owners agreed before starting.
Questions before you choose
What does a data visualization studio do?
It turns data into views people can read and act on: charts, dashboards, maps, interactive stories and the interface around them. The work covers the question being answered, the format, labeling, interaction, accessibility and, in Dardo's case, the build, as a custom web interface or a dashboard in Power BI or Tableau. It isn't data analysis or BI administration: the studio designs how information is presented, while your data owners stay responsible for the data.
How much does a custom dashboard or data visualization cost?
It depends mostly on the data, not the charts. A few clean sources with static views cost far less than live data, many interactions, maps and role-based access. We scope each data interface after seeing a representative sample. The proposal lists views, sources, states and acceptance checks, so you can compare quotes.
What's the difference between a dashboard and a data visualization?
A dashboard is one kind of data visualization: a set of measures people return to repeatedly to monitor something, usually with filters. Data visualization is broader and includes one-off charts, interactive maps, explorable data stories and reports. The design priorities differ, too. A dashboard needs fast scanning and a stable layout, while a data story needs a guided sequence and context.
What data do you need to start?
A sample with the real fields and the difficult cases is more useful than waiting for a perfect final export. We also need the source owner, field definitions, units, update frequency, the intended audience and the question the view should answer. Missing records, odd formats and edge cases are exactly what the design has to handle, so include them rather than cleaning them out first.
Can interactive charts and maps be accessible?
Yes, when accessibility is designed into structure, labels, controls, color and keyboard behavior from the start, and a table or text alternative carries the same information. Color can't be the only way to tell series apart, focus has to move in a sensible order and motion should respect reduced-motion settings. The right test depends on the interaction and the audience, and we agree it before launch.
Does Dardo verify that our data is correct?
We validate our own transformations and check displayed values against the supplied sources, using known test records. The subject-matter accuracy of the data and the authorization to publish it stay with the named data owner, unless a separate research scope is agreed. The interface shows source and date next to the numbers, so readers can check them too.
Can the dashboard or data story be in English and Spanish?
Yes. We work in both languages, so labels, number and date formats, units, notes and text alternatives are localized properly instead of translated at the end. Bilingual data interfaces need room for longer Spanish labels and consistent terminology across views, which we plan from the first sketches rather than retrofitting.
From the blog
- How to embed Power BI in a website: public, secure and Embedded options, costs and the security catch
The ways to embed a Power BI report in a website, who can see each, Microsoft's prices, the Publish to web risk and when a custom chart fits better.