The problem: evidence scattered across agencies
Information about La Guajira's communities sits in separate public systems: census and territorial data, public procurement records, disaster-response registers, municipal response layers and documents. Each is published by a different agency, on a different schedule and with different gaps, which is exactly the problem data visualization work has to respect. A team trying to decide where to look first has to stitch them together by hand, and it is easy to treat a missing value as zero or a weak signal as a fact.
What Dardo built
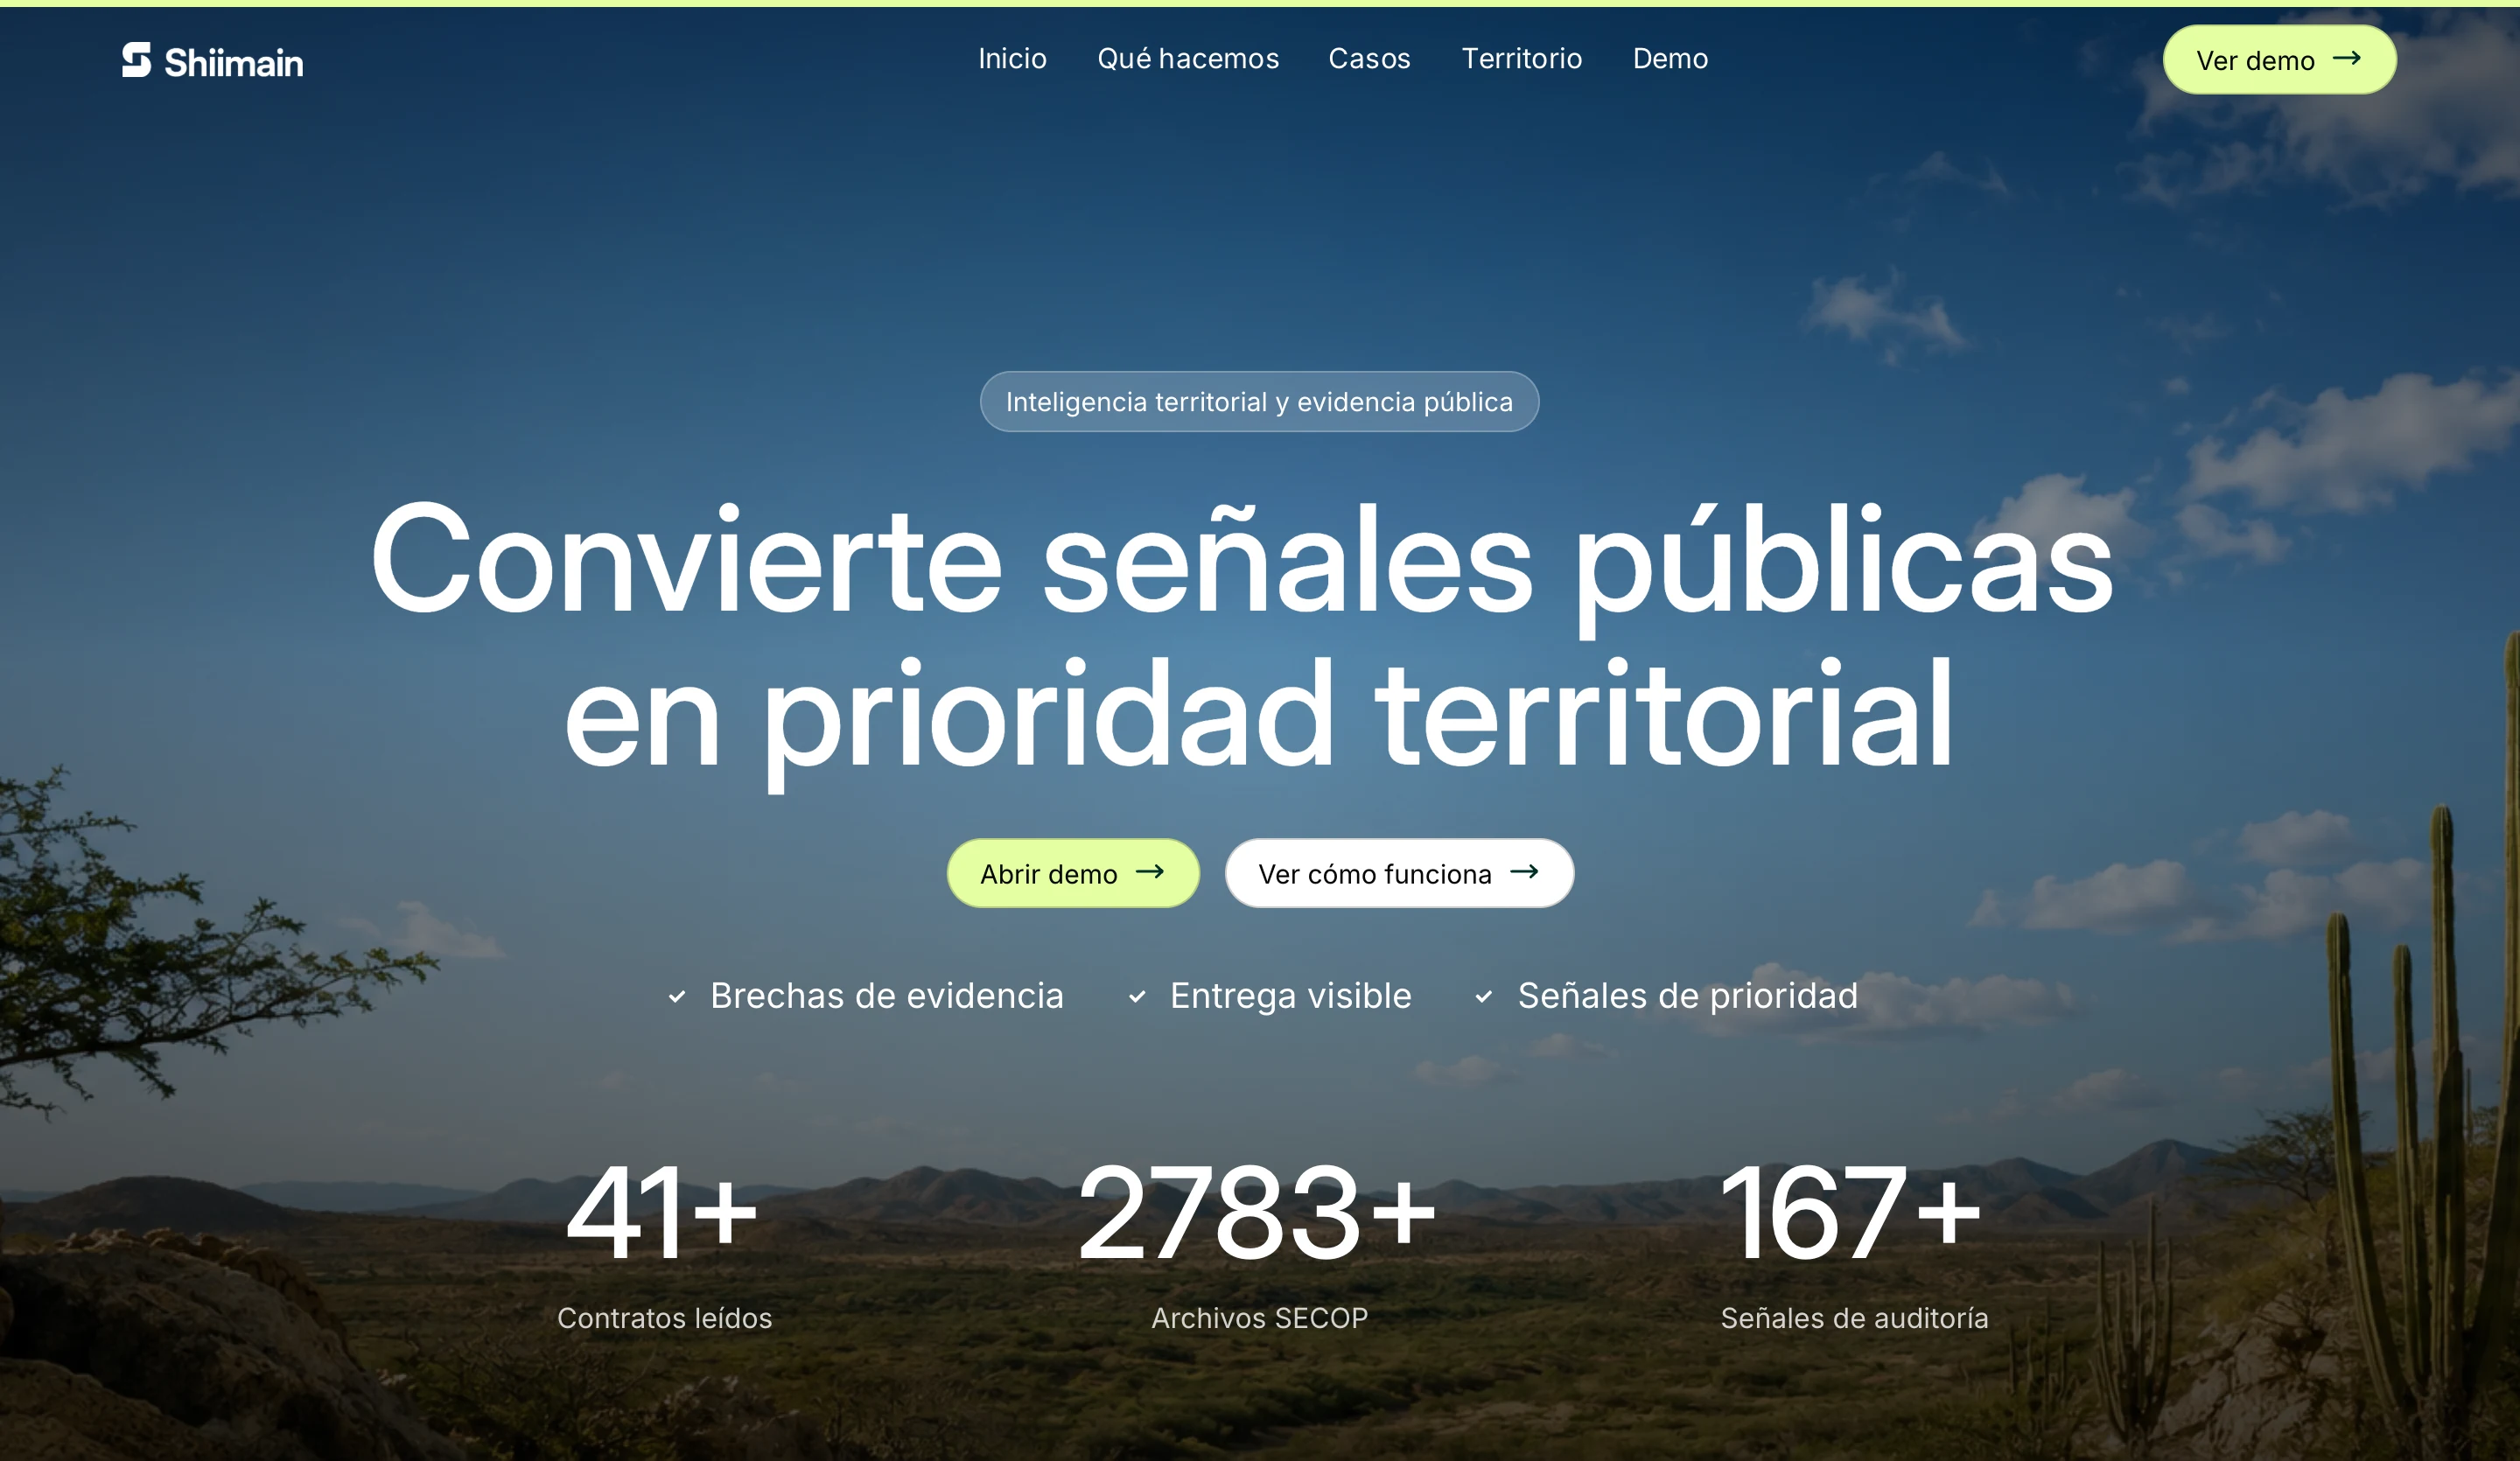
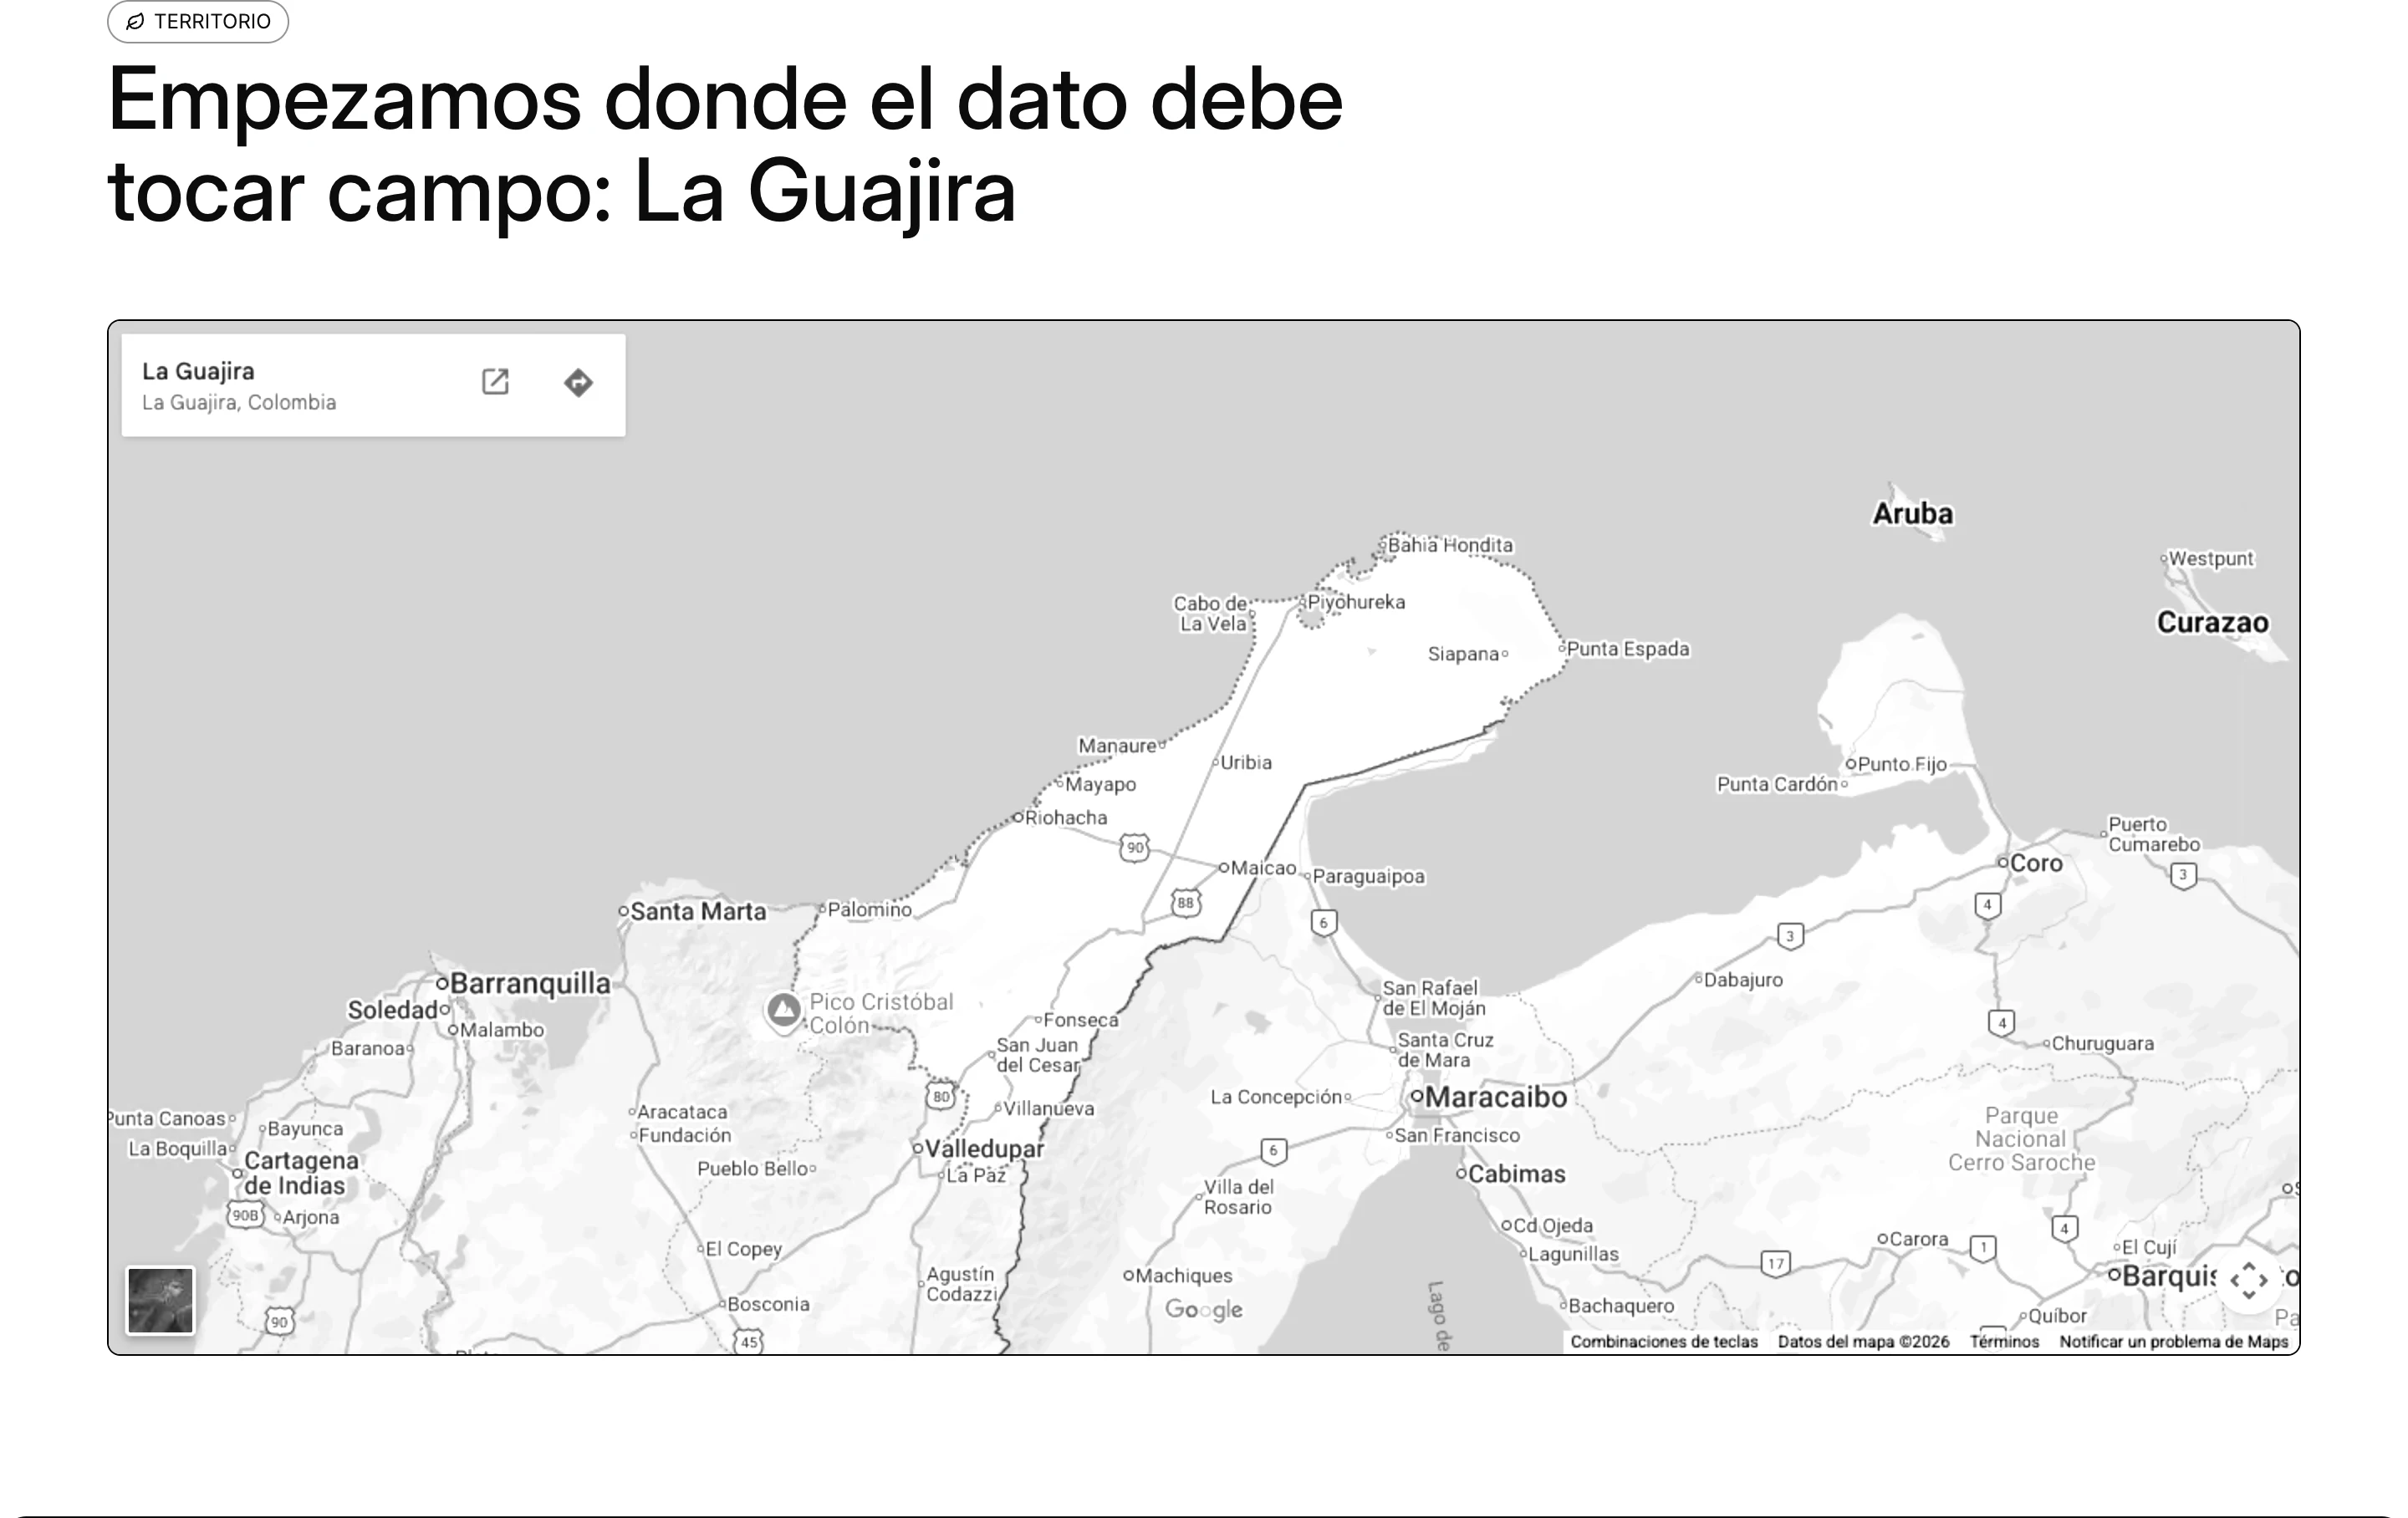
- A territory-first landing page that gives La Guajira visual and narrative presence before any chart, with an embedded map of the department.
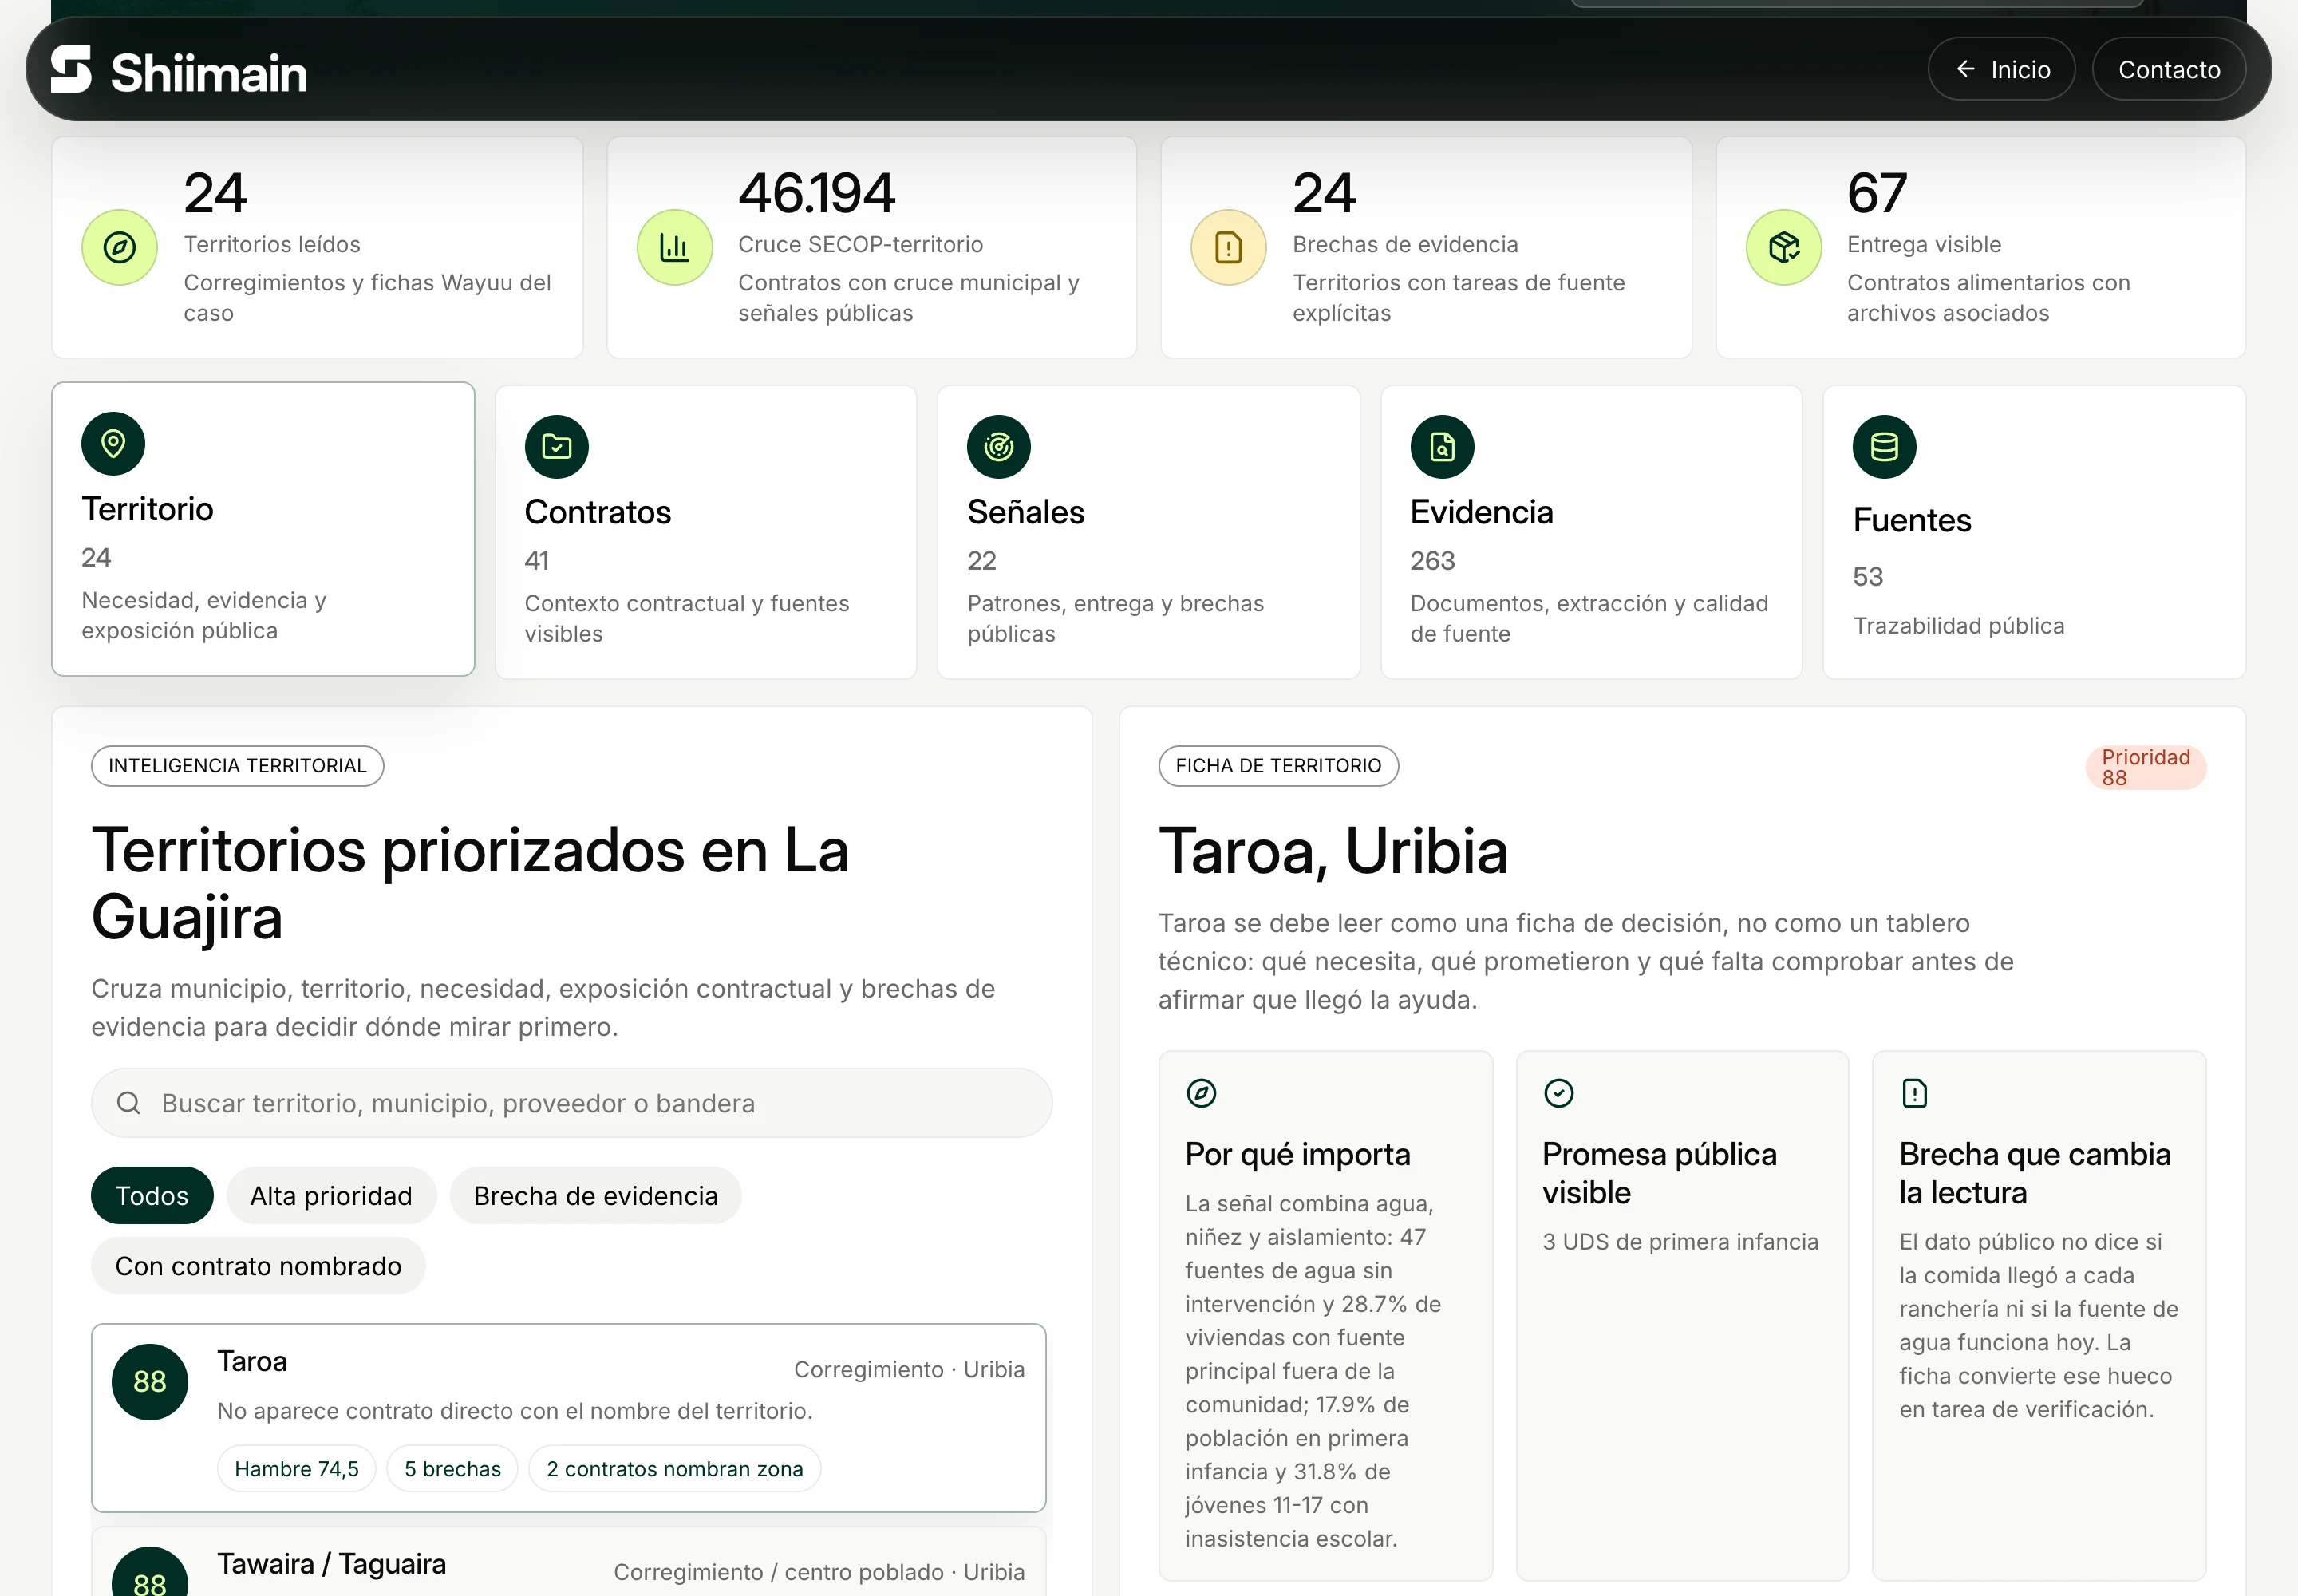
- An evidence dashboard at #/demo that ranks territories and municipalities for analysis, combining signals from SIWayuu and DANE, SECOP procurement records, UNGRD disaster-response data, municipal response layers, extracted documents and delivery-visibility datasets.
- An explicit "intelligence gap" state. When evidence is missing or weak, the interface says so instead of filling the space, and it never infers a fact the source data can't support.
- Context, not workflow. Contract and invoice fields appear only as public context signals; the demo can't approve, assign or route anything.
How it works
The demo runs entirely in the browser. Static JSON datasets, adapted from a reference data project, are imported straight into a Vite build, so there is no backend, login, database writes or operational routing. That makes it cheap to host on Vercel and easy to inspect, and it keeps the demonstration honest about what it is.
Stack
Vite 8 and React 19, with Framer Motion for transitions, Lenis for scrolling and Lucide icons, written in JavaScript and deployed on Vercel. The interface is in Spanish only, with Colombian Spanish metadata.
Implementation evidence
On 12 October 2026 we checked the live demo at shiimain.vercel.app, its dashboard view and the "Diseño: Dardo" credit in its footer, and reviewed the implementation behind it: the static datasets, the territory ranking and the gap states described above. The project was built in four days, between 27 and 30 May 2026, and is now kept as an archived learning repository.
Evidence and limits
Shiimain is a demonstration, not an operating institutional platform. It does not certify the underlying datasets, claim adoption by any agency or replace the public records it cites. Its landing layout began as a React recreation of a Framer template and was then adapted to La Guajira; the La Guajira content, evidence dashboard and gap states were built for this project. A production service would also need named data owners, refresh schedules, normalization rules and tests against official source totals.
Sources & further reading
Primary project evidence: the live deployment and implementation details reviewed by Dardo for this case.
- Shiimain live prototypeshiimain.vercel.app
- Shiimain evidence dashboardshiimain.vercel.app