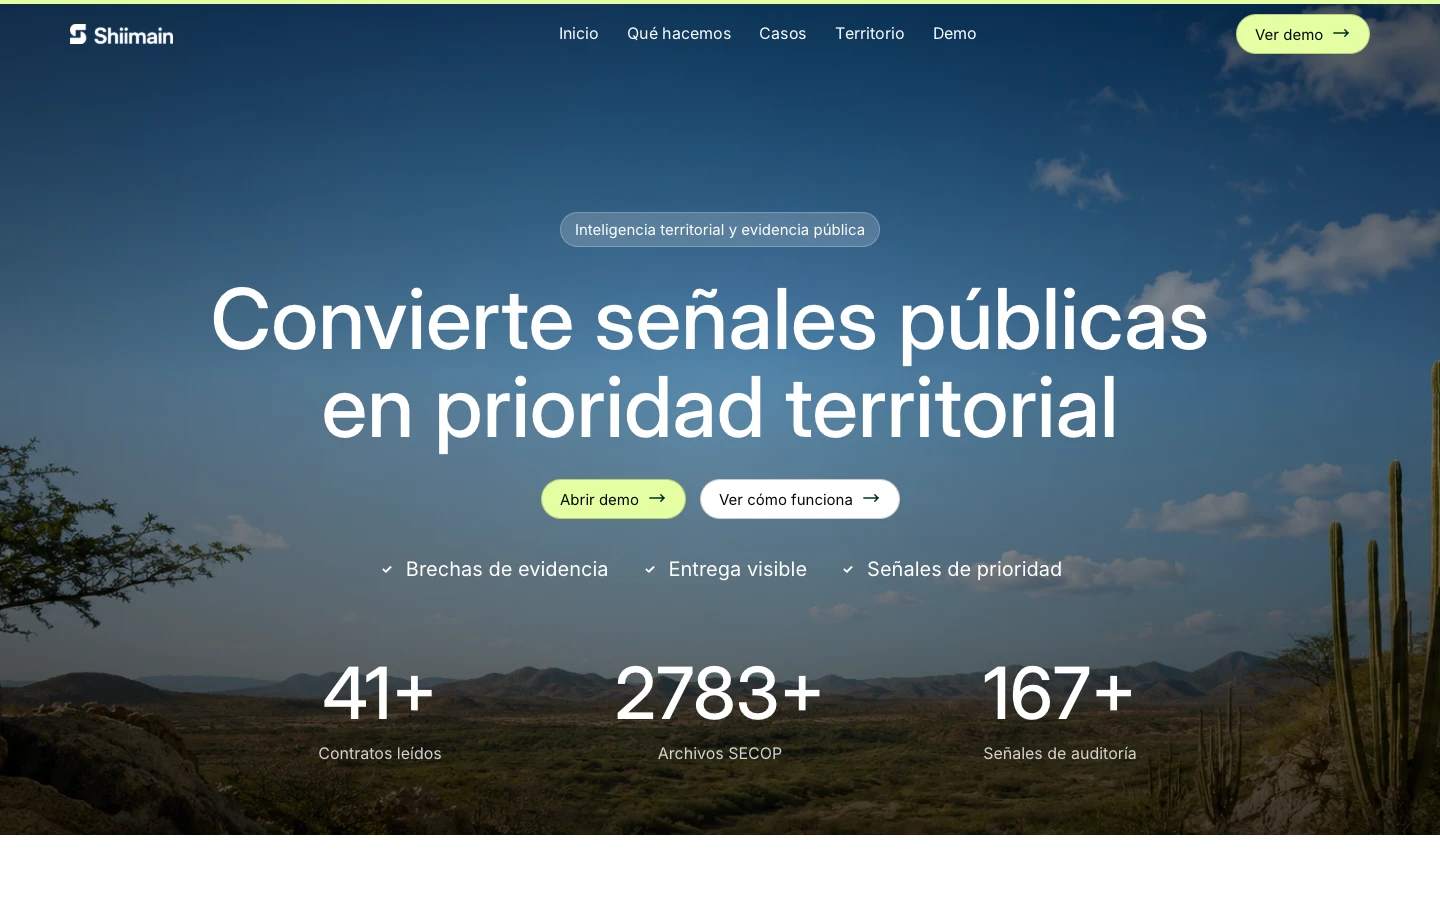
Place before the metric
Shiimain's public opening states an offer around public signals and territorial priority against a landscape image. Its navigation moves toward territory and demo views. That sequence solves a genuine information-design problem: a dashboard number has little meaning without geography, period, source and missing coverage. The visible prototype shows a narrative entrance and client-side exploration. The analysis here treats the landscape as orientation, not proof that every record has been reconciled. A territorial product would need every displayed summary to connect back to a source record and date.
A proposed evidence contract
For a production edition, define each measure with source agency, publication URL, retrieval date, geography, period, unit, transformation and known exclusions. Expose that contract in the interface where the number appears. Filters should preserve the selected place and time range while the view changes. A missing value should say 'not available for this place and period' rather than silently disappear or become zero. A comparison should disclose when two territories have different coverage. These are proposed requirements, not assertions that the archived prototype already implements ingestion, authentication or a backend.
A screen-level acceptance model
The checks below make the information promise testable before adding visual complexity.
| View | Information duty | Review question |
|---|---|---|
| Territory overview | Name selected place, period and available sources | Can a visitor tell what is and is not covered? |
| Map and comparison | Keep legend, scale, exclusions and comparable periods visible | Does changing place preserve meaning rather than only the color? |
| Shared evidence | Export source and context with the figure | Can a reader interpret a shared chart away from the site? |
What the prototype supports
The published work supports the visual journey from place to evidence and a working front-end demonstrator. The implementation review identifies a Vite and React client-side prototype without a production backend, authentication or write operations. It does not certify official data or institutional adoption. A production commission would need data-owner agreements, refresh monitoring, source-total reconciliation, accessible map alternatives, error states and a maintenance budget. The distinction lets the design logic be evaluated without overclaiming the operating system behind it.
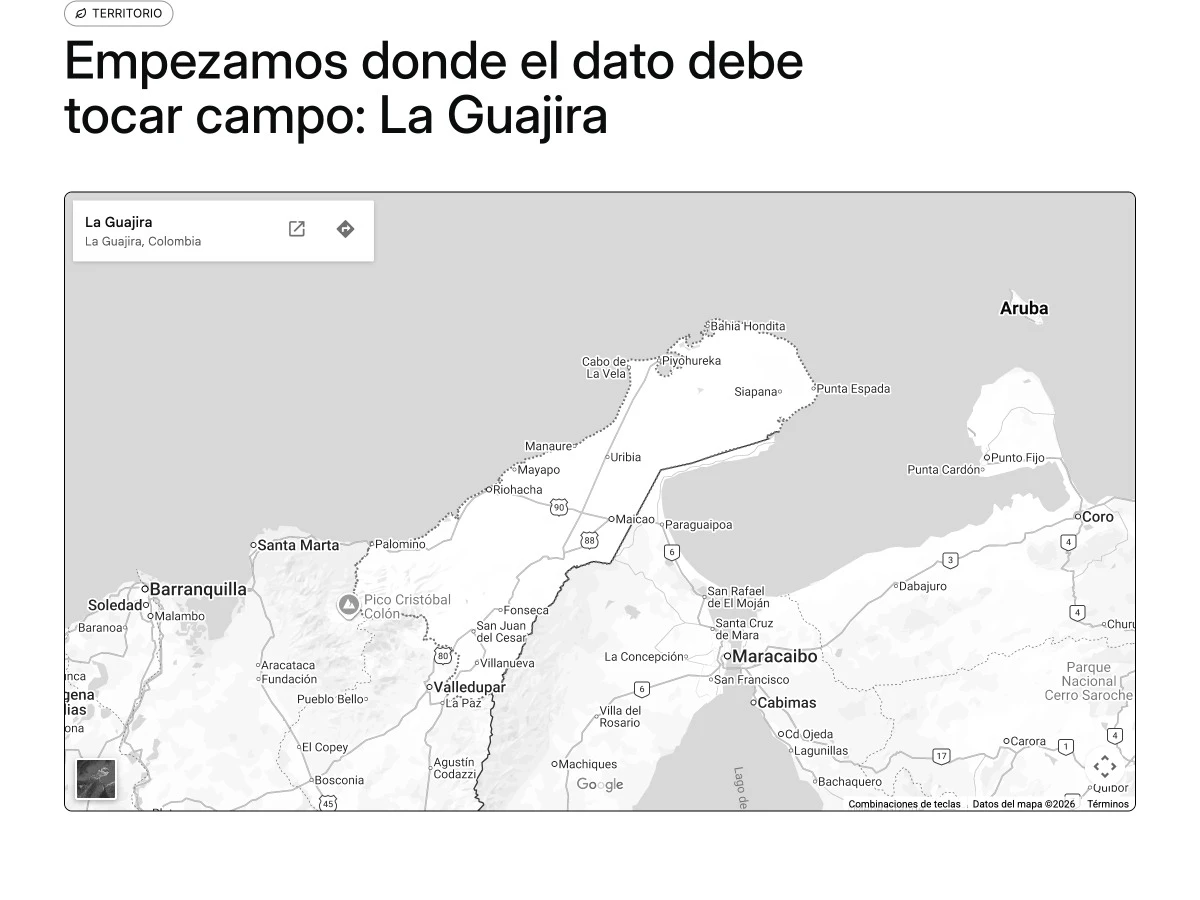
Sources & editorial notes
Sources
- Shiimain — public prototypeshiimain.vercel.app
How we built this guide
EvidenceThis guide combines 1 linked source, Dardo’s analysis and clearly labeled project examples.
LimitsVisible design and content decisions are not presented as measured ranking, traffic or conversion gains.
Read our editorial policy